How to Guide: Target Sales Forecasting (Free Template)
Landing a Target purchase order is a defining moment for consumer brands. But that excitement quickly turns to anxiety when you realize the complexity ahead: promotional planning across Circle Week and major holidays, scan-to-ship revenue timing, SKU-level forecasting across nearly 2,000 stores, and the cash implications of it all.
Most brands approach Target launches with spreadsheets held together by hope and formulas that break when you add a new SKU. Finance teams spend days building one-off models while the window to commit closes. And when the forecast misses? You're either sitting on excess inventory that killed your cash position or facing stockouts during your most critical promotional periods.
We built this template because Target launches shouldn't keep you up at night. You need to model the complete financial impact (gross revenue, trade deductions, net revenue, contribution profit) before you say yes to that PO. You need confidence in your inventory commitments and cash timing. And you need to run multiple scenarios quickly as assumptions change.
This isn't a generic forecasting template. It's purpose-built for the specific mechanics of Target: promotional intensity by period, scan-based revenue recognition with configurable lead times, account penetration tracking, and full P&L modeling from gross sales through contribution margin.
What This Template Does
This template forecasts Target account sales with the rigor required to make confident decisions about major retail partnerships. It handles multi-SKU promotional planning (expandable to 5 SKUs), models the scan-to-ship revenue bridge that's critical for accounting recognition, integrates a 2026-2027 Target-specific promotional calendar, and delivers full P&L from gross sales to contribution profit.
The goal isn't just a revenue number. It's understanding whether this opportunity makes financial sense for your business and having that answer before you commit hundreds of thousands of dollars in inventory.
Template Structure
The template is organized into distinct sections that mirror how Target partnerships actually work:
Where to Enter Forecasts: You'll input SKU-level assumptions in four key areas. The Scan-Based Sales Section captures your door count assumptions, baseline sales velocity, pricing, and promotional lift factors. The Discounts Section handles all trade spend assumptions including off-invoice discounts, bill-backs, co-op fees, and other retailer deductions. The Returns Section lets you model expected return rates. And the COGS Section captures your per-unit product costs. All of these inputs feed into the automated calculations that produce your complete forecast.
Forecast Summary Metrics: Rows 31-37 provide your executive summary. This is where the template synthesizes all your inputs into the metrics that matter for decision-making. You'll see promotional intensity guidance based on the calendar, total doors across all active SKUs, account penetration as a percentage of Target's store base, gross revenue before any deductions, total trade spend as a percentage of gross sales, net revenue after all deductions, and contribution profit showing your bottom-line profitability. These seven metrics give you the complete picture of financial performance without drowning in detail.
Target Promo Calendar Tab: This is pre-populated with 2026-2027 Target-specific promotional events and their intensity levels. Heavy promotional periods (intensity 1.0) include Circle Week occurring in March, July, and October, Back-to-School from July through August, and the critical holiday season from November through December. Moderate promotional periods (intensity 0.5) cover MLK Day, Presidents Day, Memorial Day, and Labor Day. Light or non-promotional periods (intensity 0.0) include Easter, Father's Day, and other standard retail dates. The template uses these intensity factors to automatically adjust your promotional lift assumptions month by month. You can update dates or add 2028+ data as needed. The formulas auto-update to keep everything connected.
Troubleshooting: The template includes built-in validation. If ship-based revenue equals zero, check that lead time is set in cell D19 and that scan units are properly populated in your forecast inputs. If promotional allowances aren't flowing through to your P&L, ensure both promo_discount_pct and promo_flag are set correctly in your promotional planning rows.
How the Forecast Flows
Understanding how data flows through this template helps you use it effectively and troubleshoot when needed.
Scan-Based Sales represent when products actually scan at Target registers. This is consumer demand. You input baseline velocity per door, the number of doors carrying each SKU, pricing, and promotional assumptions. The template calculates total scan volume by multiplying your per-door assumptions across your total door count and applying promotional lift factors from the calendar.
Ship-Based Revenue is what matters for accounting. This is offset by lead time from scan-based sales since you recognize revenue when products ship to Target, not when consumers buy them. With the default two-month lead time, January shipments translate to March scan sales. The template automatically handles this timing offset. You set the lead time parameter in D19 and it flows through the entire model.
Trade Spend and Deductions are automatically calculated from your assumptions. Consumer-facing discounts during promotional periods tie directly to your promotional calendar through the promo_flag and promo_discount_pct inputs. These promotional allowances are auto-calculated from promo units × regular price × discount percentage, ensuring your consumer promotions flow directly into trade spend in the P&L.
The P&L brings everything together. Starting with gross revenue (total ship-based revenue before deductions), it subtracts all trade spend to reach net revenue, deducts COGS to show gross profit, and arrives at contribution profit: your bottom-line profitability from this account. Every line item traces back to specific assumptions you control.
Key Settings You Need to Configure
Before you start forecasting, configure these critical parameters that shape how the entire model behaves.
Shipment Lead Time (default 2 months) controls when products ship versus when they scan. If your product ships in Month 1, it scans in Month 3 with a two-month lead time. Change cell D19 to adjust this scan-to-ship offset timing based on your specific supply chain timing.
Wholesale Margin (cell D21) lets you model the financial impact if you're selling through a wholesale partner rather than directly to Target. This affects how much of the retail price flows to you versus staying with the wholesaler.
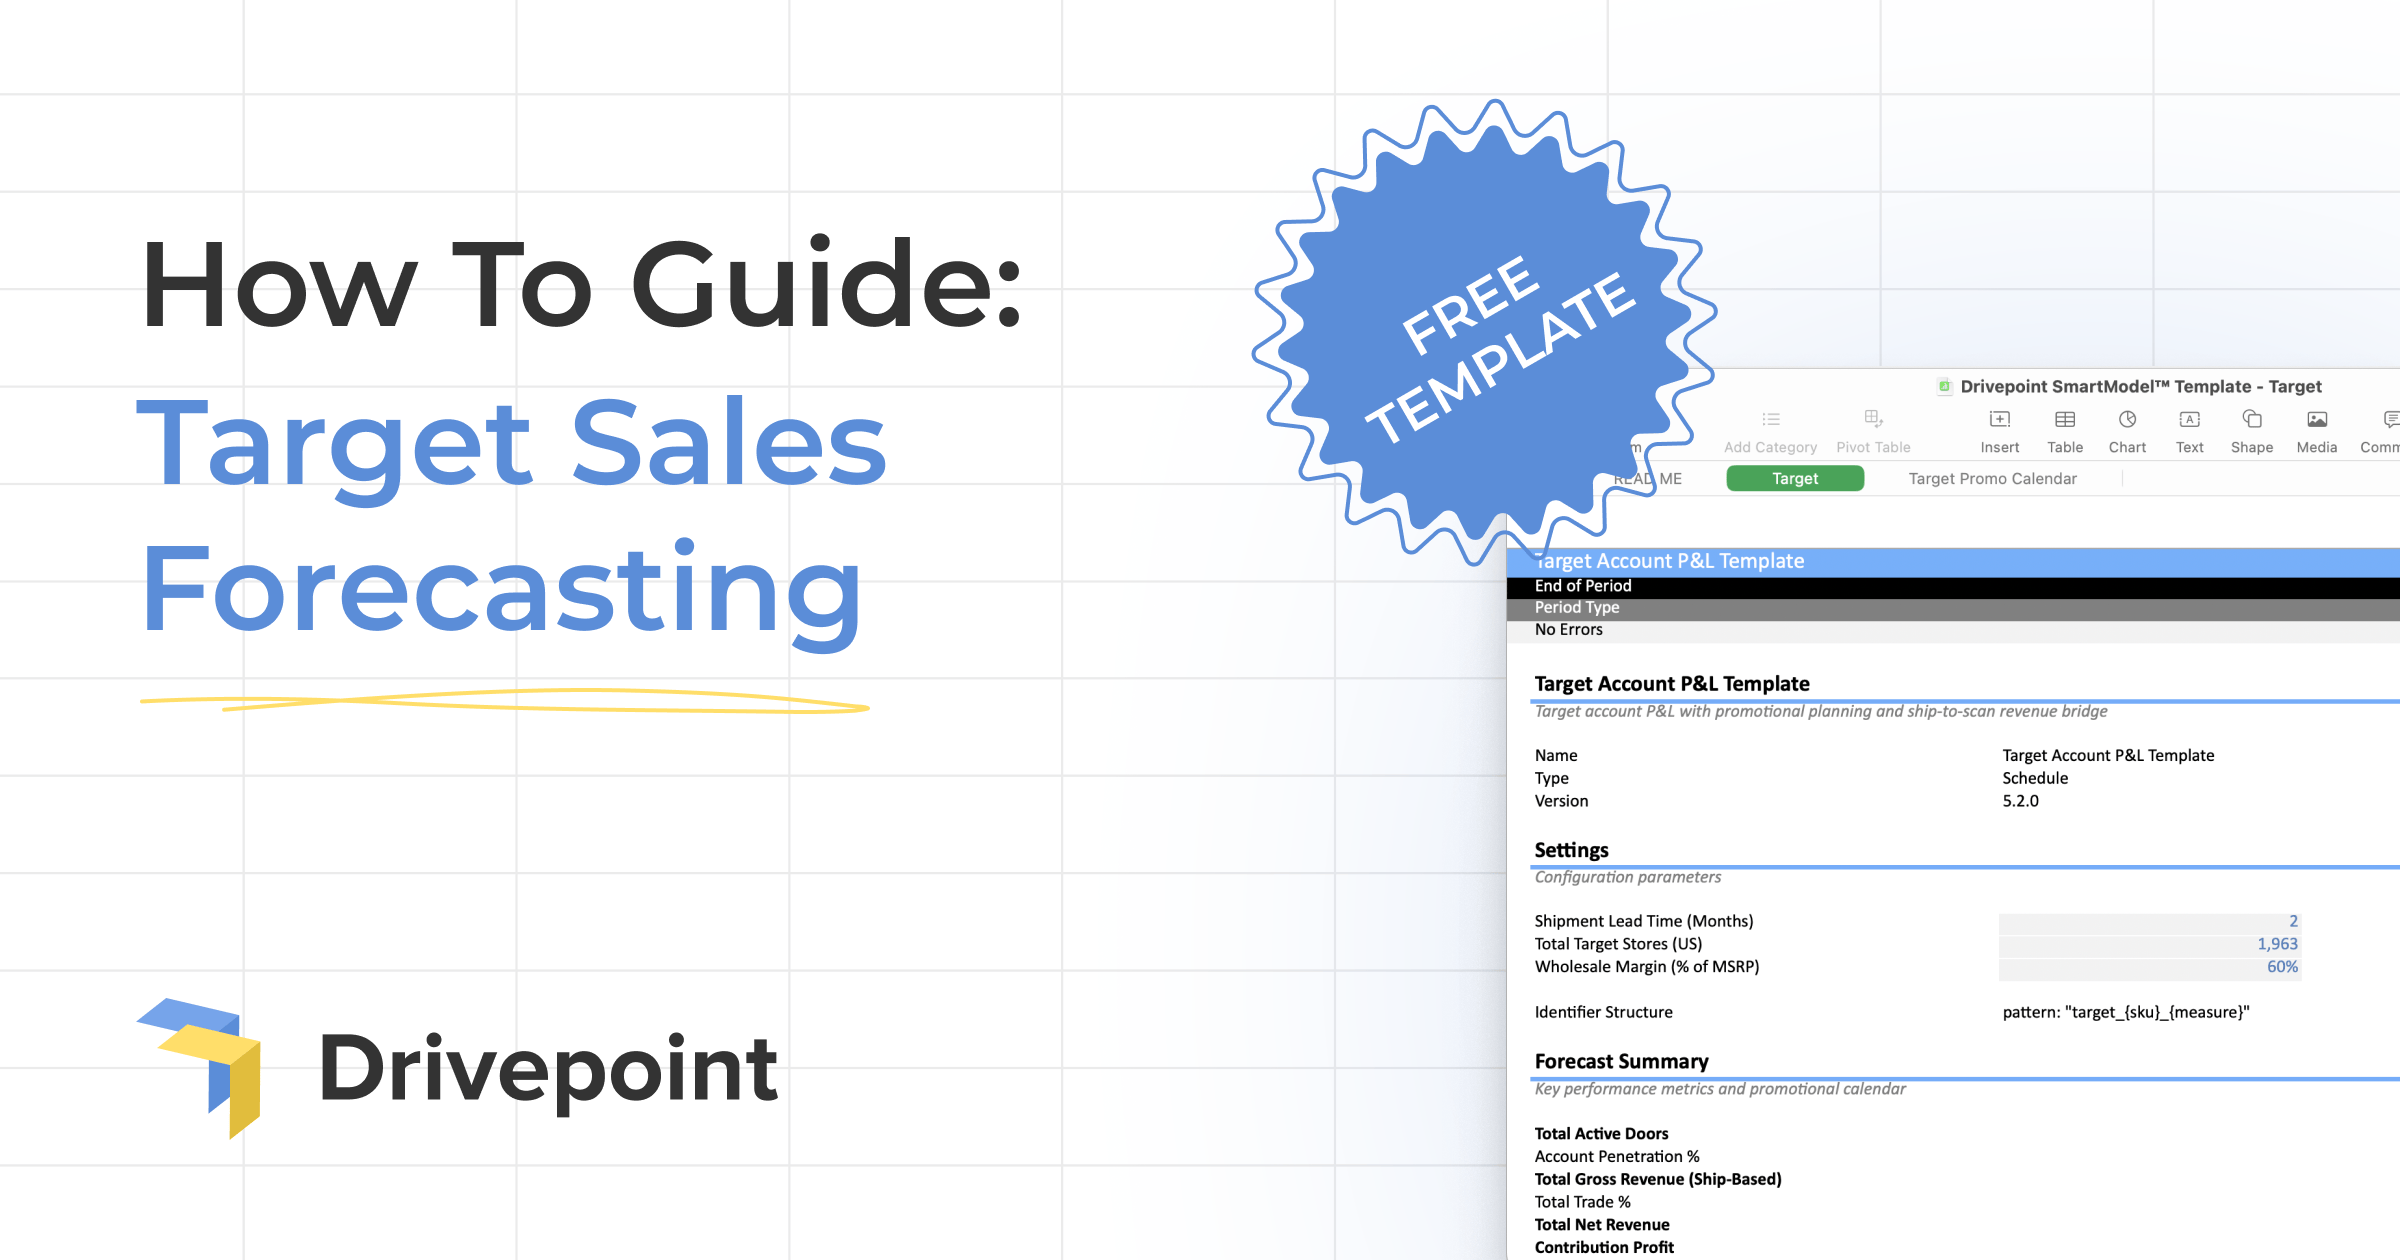
Total Target Stores is set to 1,963 stores (cell D23) for penetration percentage calculations. This gives you a sense of scale. Are you launching in 5% of stores or 50%?
SKU Names should be customized to match your actual product names and categories. Use find and replace throughout the template to swap placeholder names with your real SKUs. This makes the model yours and ensures everyone understands what they're looking at.
Getting Started: The Quick Start Guide
Here's how to go from blank template to complete forecast in the right sequence.
First, review the Target Promo Calendar tab to understand the 2026-2027 promotional events that will drive your sales patterns. Understanding when Circle Week, Back-to-School, and Holiday periods occur shapes everything else.
Second, in the Target tab, check the Forecast Summary (rows 28-34) to see what key metrics the template will calculate. Knowing what output you're building toward helps you understand why each input matters.
Third, enter your forecast assumptions in the GRAY cells for months 25-48 (the forecast period). These gray cells are where you input your assumptions. White cells contain formulas that auto-calculate.
Fourth, use the Promo Guidance rows to align your promo_flag inputs with the Target promotional calendar. When the calendar shows high promotional intensity, set your promo_flag to 1. This creates the connection between Target's promotional cadence and your sales assumptions.
Fifth, let the template work. All formulas auto-calculate from your inputs through to contribution profit. You don't need to touch formula cells. Just review the outputs to understand what your assumptions mean financially.
Understanding Revenue Recognition Flow
This is where many brands get tripped up, so it's worth understanding clearly.
Scan-Based Sales show units and revenue when products scan at Target registers. This represents actual consumer demand and is what you see in Target's reporting systems.
Ship-Based Revenue is offset by lead time for accounting recognition. The template uses lead time set in D19 to automatically shift scan sales backward in time. With a two-month lead time, January shipments become March scan sales. Why does this matter? Because your P&L uses ship-based revenue for all accounting calculations. This is when you recognize revenue and when cash timing occurs.
Here's the example the template uses: with a two-month lead time, January shipments equal March scan sales. The products you ship in January sit in Target's distribution center and stores during February, then consumers buy them (scan) in March. Your accounting recognizes the revenue in January when you shipped, but the consumer demand happens in March. This timing difference is critical for cash planning and understanding when you'll actually get paid.
Promotional Planning Mechanics
Target's promotional calendar drives significant volume, but only if you plan for it correctly.
The Promo Flag should be set to 1 for promotional months and 0 for non-promotional periods. Reference the Promo Guidance rows (39-40) which connect to the Target promotional calendar. When you see high promotional intensity in the calendar, set your promo_flag to 1 in the corresponding month.
Promo Discount Percentage represents the consumer-facing discount (e.g., 0.20 equals 20% off retail). This drives how much lift you'll see and how much trade spend you'll incur.
Promo Lift Factor is the sales multiplier during promotional periods (e.g., 2.0 equals 100% incremental lift). If your baseline is 100 units per door and you apply a 2.0 lift factor, you'll sell 200 units per door during that promotional month.
Promo Allowances are auto-calculated from promo units × regular price × discount percentage. This ties consumer-facing discounts directly to trade spend in the P&L. You're not entering trade spend manually. The template calculates it from your promotional assumptions, ensuring consistency between what consumers see and what you pay Target.
The template's genius is connecting Target's promotional calendar (Circle Week, BTS, Holiday) to your specific promotional strategy (discount depth, lift expectations) and automatically flowing that through to financial impact.
What Makes This Different from Generic Templates
This isn't a repurposed forecasting template with "Target" slapped on top. It's built specifically for how Target partnerships work.
Target-Specific Promotional Calendar: Pre-populated with 2026-2027 Target promotional events and intensity levels. You're not guessing when Circle Week occurs or whether Memorial Day is a big promotional period for Target. It's built in.
Scan-to-Ship Revenue Bridge: Most templates only model one revenue timing. This template understands that scan revenue (consumer demand) and ship revenue (accounting recognition) are different and manages the offset automatically.
Multi-SKU Support: Expandable to 5 SKUs with full promotional planning for each. You can model your complete Target assortment with different promotional strategies per SKU.
Complete P&L Modeling: From gross sales through trade deductions to contribution profit. You're not just forecasting revenue. You're understanding profitability and whether this partnership makes financial sense.
Promotional Mechanics: Direct integration between promotional discounts consumers see and trade spend in your P&L. The math is connected, ensuring your promotional strategy translates accurately to financial impact.
Account Penetration Tracking: Automatic calculation of what percentage of Target's 1,963 stores you're in. This context matters for understanding your scale and growth opportunity.
When to Use This Template
This template is purpose-built for specific decision points in your Target partnership journey.
Evaluating a Target PO: Before you commit to a large purchase order, model the complete financial impact. Understand gross revenue, trade deductions, net revenue, contribution profit, and inventory requirements. Run scenarios with different door counts, promotional strategies, and pricing to see what makes the partnership work financially.
Planning a Target Launch: Model different launch scenarios: conservative door count vs. aggressive, baseline promotional strategy vs. heavy promotion, different SKU assortments. Understand what you're signing up for before you're locked in.
Reforecasting During Partnership: As actual performance comes in, update assumptions and reforecast the remainder of the year. See if you're on track to hit targets or need to adjust strategy.
Board or Investor Reporting: Professional, detailed financial modeling of a major retail partnership. Show the complete picture from scan sales through contribution profit with promotional calendar integration.
Cash Planning for Inventory: Use ship-based revenue timing to understand when cash outflows (inventory purchases) occur relative to cash inflows (payment from Target). Model working capital requirements for large Target commitments.
What You'll Know After Using This Template
After building your forecast with this template, you'll have confidence in several critical areas.
You'll know whether the Target partnership makes financial sense at different scales. Model 100 doors vs. 500 vs. 1,000 and see how unit economics change. Understand what penetration level you need to hit profitability targets.
You'll understand cash requirements and timing for inventory commitments. The ship-based revenue model shows when you need to place POs relative to when you'll get paid, helping you plan working capital needs.
You'll see how promotional strategy affects profitability. Running heavy promotions during Circle Week drives volume but compresses margins. The template quantifies that trade-off so you can make informed decisions.
You'll have confidence in your numbers when presenting to boards, investors, or internal stakeholders. This isn't back-of-napkin math. It's a complete financial model with promotional calendar integration and full P&L flow.
You'll be prepared for "what if" conversations. "What if Target wants to expand to 500 doors?" "What if we need to run deeper promotions?" "What if our baseline velocity is 20% lower?" Run the scenarios in minutes instead of rebuilding the model from scratch.
Get the Template
This is the level of financial rigor that Target partnerships require. You're committing significant inventory dollars, managing complex promotional timing, and building a partnership that could define your brand's trajectory.
Download the Target Sales Forecasting Template.
The template gives you the foundation to model Target with confidence. But if you're managing multiple retailers, dozens of SKUs, and need to integrate actuals with forecasts automatically, you've probably realized the limits of spreadsheets.
That's what Drivepoint solves. We automate the data consolidation, manage your complete financial model in Excel (making it smarter, not replacing it), and enable instant scenario planning for every major decision. Our customers improve EBITDA margins by 6.7 percentage points on average within their first year. Not by working harder in spreadsheets, but by using tools built specifically for consumer brand FP&A.
When you're ready to move beyond templates and build enterprise-grade financial planning capabilities with a lean team, we're here to help.