
Why Sephora Financial Planning Is More Complex Than Your Other Retail Accounts
Managing a Sephora retail account requires navigating promotional calendars, trade spend agreements, and margin calculations that differ significantly from DTC or Amazon operations. With Sephora's signature sales events like the Beauty Insider Sale, Weekly Wow deals, and Holiday Savings Events driving substantial volume, accurate financial forecasting becomes essential for protecting profitability.
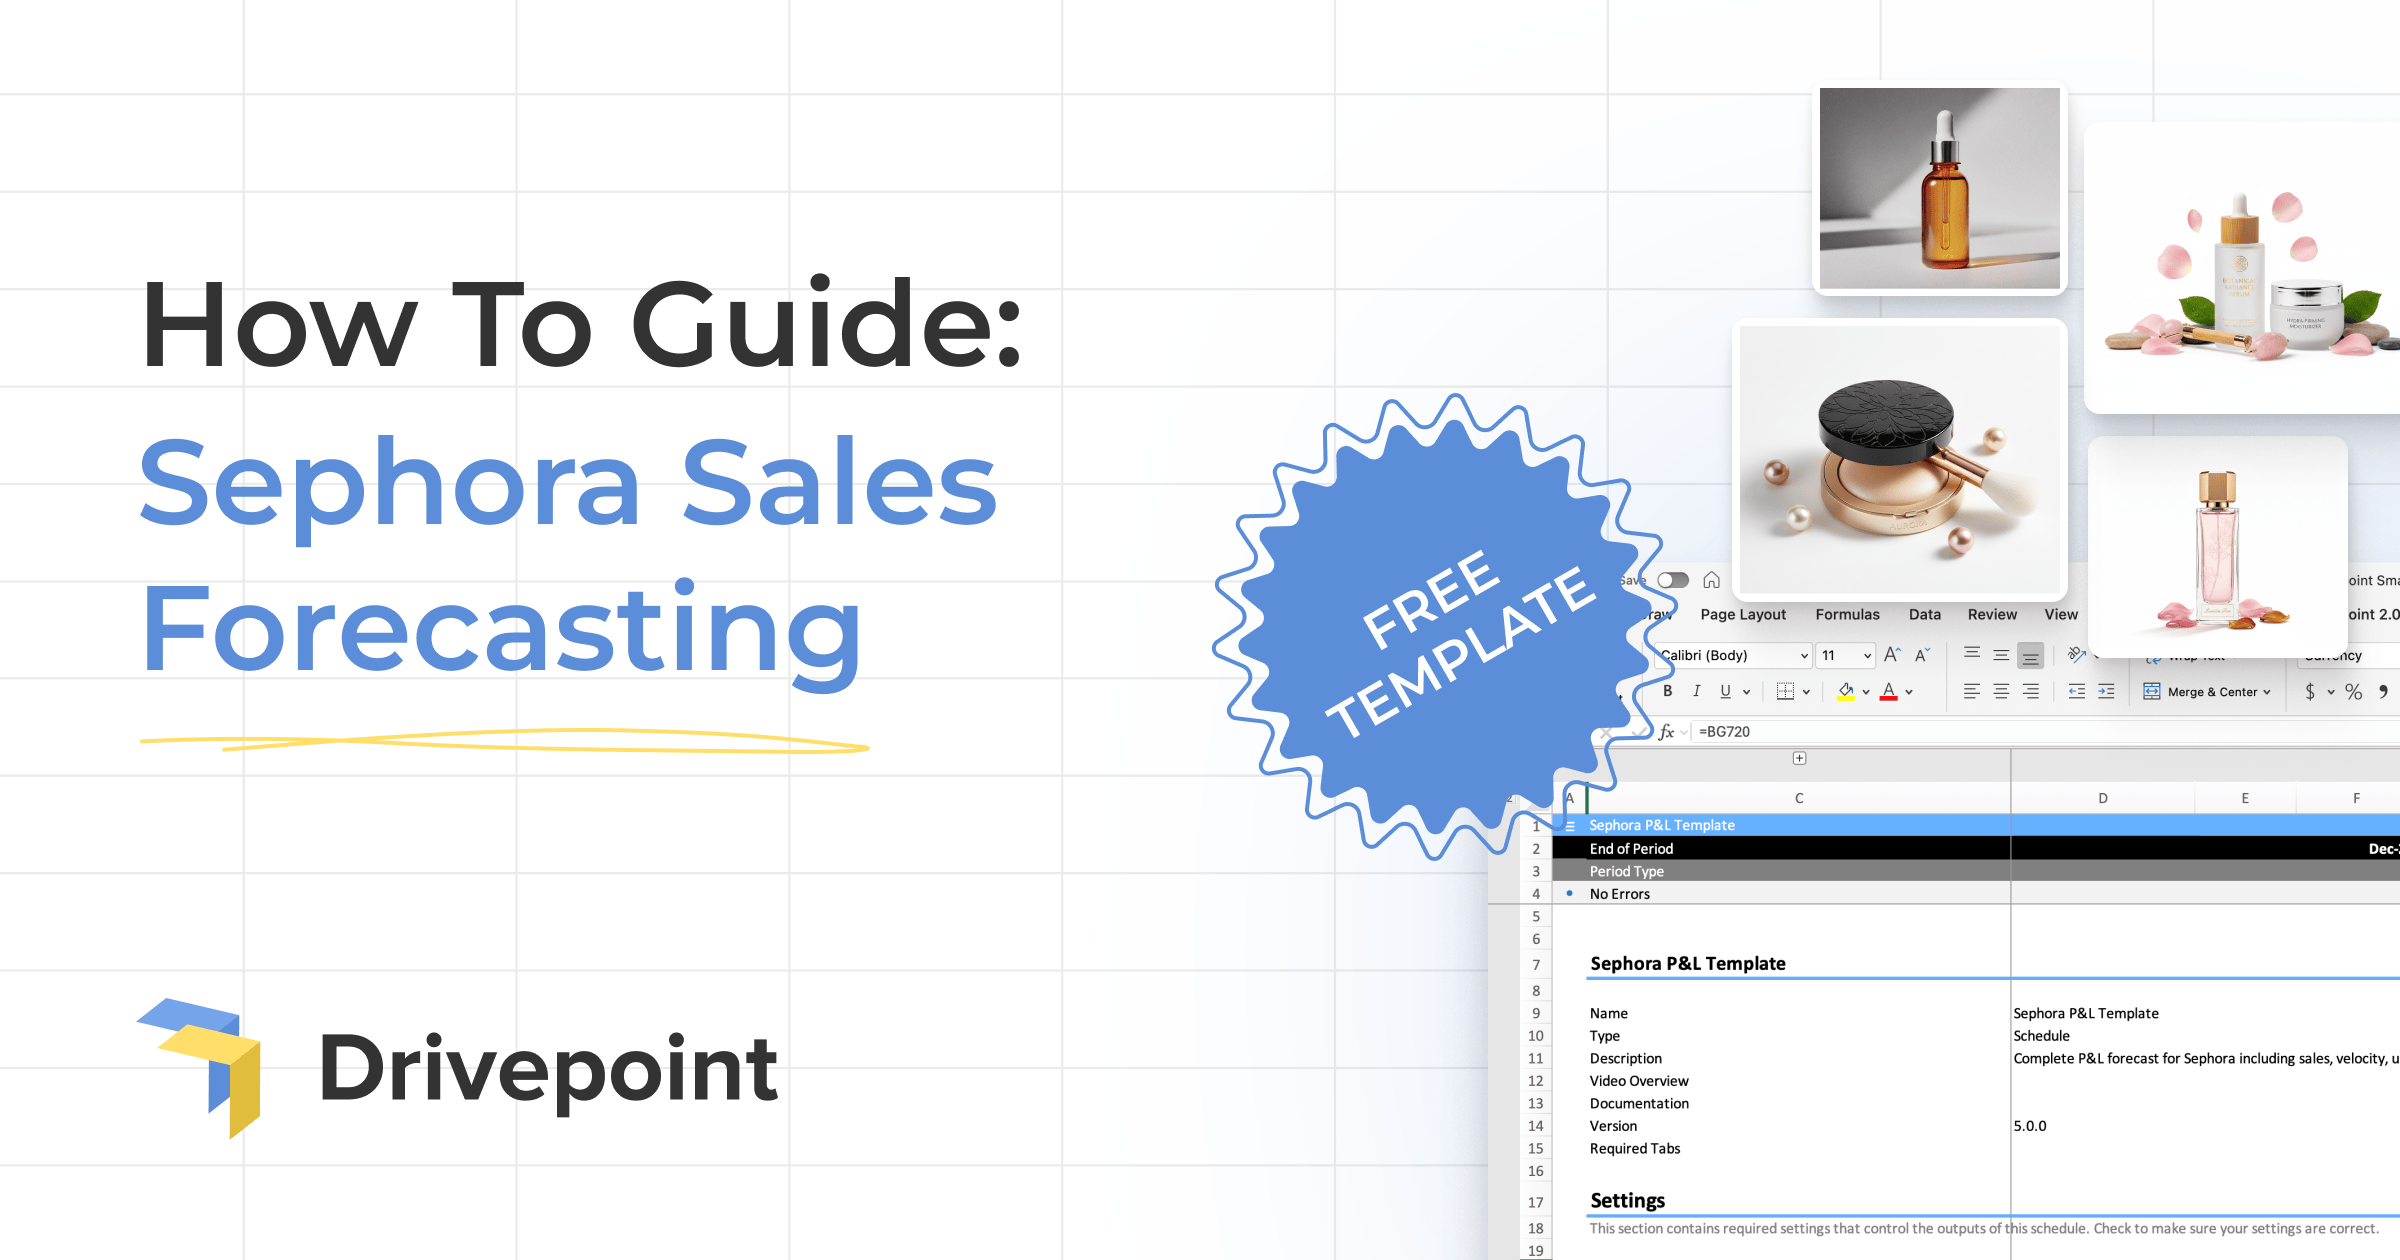
This guide walks you through our free Sephora P&L forecasting template, designed specifically for consumer brands selling through Sephora's wholesale channel. You'll learn how to forecast sales velocity, calculate trade spend impact, manage COGS, and generate a complete profit and loss statement for your Sephora account.
Download the free Sephora P&L forecasting template here and follow along as we walk through each section: https://www.drivepoint.io/templates/sephora
Understanding the Sephora P&L Template Structure
The template follows a comprehensive P&L structure that mirrors how Sephora wholesale accounts actually operate. Unlike simpler DTC forecasting models, this template accounts for the unique complexities of retail partnerships, including markdown allowances, co-op advertising, and volume-based rebates.
Built on the Drivepoint SmartModel™ specification, this template is AI-ready, which means it's designed to work seamlessly with modern financial planning tools. The structure includes named ranges, consistent formatting, and clear documentation that makes it easy for both humans and AI systems to understand and manipulate your forecasts.
Key Template Sections
- Settings Dashboard: Central control panel for all your key assumptions including sell-through rates, promotional lift factors, and margin targets
- Account Summary: High-level P&L view showing gross sales, trade spend, net revenue, COGS, and contribution margin
- Revenue Breakdown: Detailed forecasts by SKU, tracking velocity, units sold, and gross sales before discounts
- Trade Spend Calculator: Line-by-line accounting of promotional costs, markdown allowances, and co-op spending
- COGS Management: Product-level cost tracking that flows through to your final margin calculations
Before diving into the detailed walkthrough, make sure you've downloaded the template so you can follow along with each step and start building your own Sephora account forecast.
Step 1: Setting Up Your Baseline Assumptions
Begin by opening the template and navigating to the Settings tab where you'll establish your foundational assumptions. The template uses a blue cell system with • symbols to indicate where you should input data. White cells without this symbol contain formulas that calculate automatically—don't edit these.
Start with your product catalog. Scroll to Row 69 where you'll see placeholder product names. Replace these with your actual SKUs (the identifiers in Column B update automatically via formulas). Then enter your wholesale price that Sephora pays per unit.
Defining Store Distribution (Doors)
The first critical input is your door count—the number of Sephora stores carrying each product. Find the Doors section in your template and enter store counts month by month for each SKU. This metric forms the foundation of your entire forecast because it defines your distribution footprint.
For new product launches, you'll typically start with 200-400 stores, expanding based on performance and Sephora buyer commitment. Established products often reach 500-600 stores, while hero SKUs can be available across Sephora's entire North American footprint of 700+ standalone stores (note this excludes Sephora shops inside JCPenney or Kohl's, which operate under different wholesale agreements). Use your distribution agreement and planned rollout schedule to determine these numbers.
Forecasting Sales Velocity
Sales velocity represents your baseline sell-through rate before promotional impacts. Look at your historical data from Sephora's vendor portal or your EDI reports to identify average weekly sales per door. If you're launching a new product or entering new stores, use comparable products as benchmarks and apply conservative assumptions until you establish real performance data.
For new product launches, use a ramp-up pattern in the template. Month one velocity starts lower (2.0-2.5 units) as customers trial the product. Months two and three see velocity increases (3.0-3.5 units) as repeat purchases begin. Month four onward reflects stabilized performance (3.5-4.0+ units). Account for seasonality by adjusting velocity month by month—beauty products often spike during holidays, back-to-school, and major Sephora events. These seasonal adjustments can improve forecast accuracy by 15-25% compared to flat projections.
Promo lift represents the sales multiplier during promotions. Light promotions (10% off or gifts with purchase) typically generate 1.1-1.3x lift, medium promotions (15-20% off) drive 1.4-1.6x lift, and heavy promotions (25%+ off during Beauty Insider Sale) can achieve 1.8-2.5x lift. Base these assumptions on your historical promotional performance or category benchmarks from Sephora.
For example, if you forecast 450 doors with 3.5 units per store per week velocity, the template calculates baseline monthly units as 450 × 3.5 × 4.33 weeks = 6,815 units. If you add a promotional period with 1.5x lift for 7 days, the template automatically adjusts units for that period, flowing through to revenue calculations.
Step 2: Modeling Trade Spend and Promotional Impact
Trade spend management separates profitable Sephora accounts from money-losing ones. The template includes dedicated sections for tracking every dollar that flows back to Sephora through promotional activities, markdown allowances, and co-op advertising.
Planning for Sephora's Major Promotional Events
Sephora runs several signature promotional events throughout the year. The Beauty Insider Sale (spring and fall) offers tiered discounts to loyalty members: Rouge members receive 20% off, VIB members get 15% off, and Insider members receive 10% off. During these events, you'll need to model both the increased volume and the reduced net revenue per unit.
Weekly Wow deals feature select products at promotional prices each week, typically requiring 20-30% discounts. Holiday Savings Events in November and December drive significant volume but compress margins through promotional participation. The Sephora Savings Event in spring offers similar tiered discounts to the Beauty Insider Sale.
In the template, designate which months include major promotional participation. Apply promotional lift factors (typically 2-4x baseline velocity during promotional periods) and corresponding markdown allowances. For example, if you're participating in a Beauty Insider Sale, you'll typically fund 50-75% of the discount while Sephora covers the remainder through their loyalty program.
Using the Template's Promotional Inputs
The template includes three promotional fields that work together. Promo Depth is where you enter the discount percentage (0% for regular price months, 15% or 20% for promotional months). Promo Length specifies how many days the promotion runs (0 for non-promotional months, 3-7 days for Beauty Insider Sale, 7 days for Weekly Wow features).
Promo Lift captures the sales multiplier effect. Enter 1.0 for months without promotions. For promotional periods, light promotions (10% off or GWP) typically generate 1.1-1.3x lift, medium promotions (15-20% off) drive 1.4-1.6x lift, and heavy promotions (Beauty Insider Sale participation) achieve 1.8-2.5x lift. Base these on your historical performance or ask your Sephora buyer for category benchmarks.
Types of Trade Spend to Track
- Markdown allowances: Your share of promotional discounts offered to consumers
- Co-op advertising: Contributions to Sephora's marketing of your products, including email features and in-store displays
- Slotting fees: One-time or annual fees for shelf placement and merchandising support
- Volume rebates: Tiered discounts based on hitting revenue thresholds
- Returns and damages: Expected product returns that reduce net revenue
- Loyalty program funding: Contributions to Beauty Insider rewards and point accelerators
Build realistic assumptions for each type of trade spend based on your contracts with Sephora and historical performance. If you're forecasting a first-year partnership, industry benchmarks suggest trade spend typically runs 25-40% of gross wholesale revenue for beauty brands at Sephora, though this varies significantly by category and brand positioning. Prestige brands may see slightly lower trade spend rates than mass brands.
Pro tip: The Sephora P&L template includes pre-built formulas for all trade spend calculations, so you can simply input your contract terms and see the impact immediately.
Step 3: Calculating Your True COGS
Accurate COGS calculations determine whether your Sephora account actually generates profit. The template guides you through calculating fully-loaded product costs that many brands overlook.
Components of True COGS
Manufacturing costs represent your baseline, but your actual COGS includes several additional layers. Add your packaging costs (primary and secondary), freight from manufacturer to your warehouse, and freight from your warehouse to Sephora's distribution centers. Many brands discover their true per-unit COGS runs 15-25% higher than their manufacturing cost alone.
The template automatically calculates gross margin by subtracting COGS from net revenue (gross sales minus trade spend). This gives you visibility into whether promotional participation erodes margins to unsustainable levels. A healthy beauty brand typically targets 65-75% gross margin on wholesale accounts at Sephora, with prestige brands often achieving higher margins while contemporary brands operate with slightly thinner margins.
Step 4: Building Your Complete P&L View
With your revenue, trade spend, and COGS inputs configured, the template generates your complete Sephora account P&L. The Account Summary tab provides month-by-month visibility into gross sales, net revenue, gross profit, and contribution margin.
This P&L structure mirrors how Sephora actually processes your invoices and deductions. You'll see exactly how promotional participation impacts net revenue, and how that flows through to your bottom line profitability. Use this view to model different scenarios: what happens if promotional lift is lower than expected? What if trade spend increases? How does launching new SKUs change overall account profitability?
How the Template Calculates Your Results
Once you've entered doors, velocity, and promotional parameters, the template handles all calculations automatically. White cells without the • symbol show calculated values you shouldn't edit. The template computes effective velocity (baseline adjusted for promotional lift), total units (doors × velocity × weeks, adjusted for promotions), gross revenue, net revenue after discounts, and monthly totals.
For example, if you forecast 450 doors with 3.5 units per store per week velocity, the template calculates baseline monthly units as 450 × 3.5 × 4.33 weeks = 6,815 units. If you add a promotional period with 1.5x lift for 7 days, the template automatically adjusts units for that period, flowing through to revenue calculations.
Forecast Completion Checklist
Before moving to scenario planning, verify you've completed these steps for each product: entered product names in Column C, filled in door counts for all forecast months, entered velocity assumptions across your planning horizon, added promotional depth and length for planned events, specified promotional lift factors, and confirmed all calculated cells show reasonable outputs without formula errors.
Review your promotional calendar to ensure it aligns with Sephora's planned events. Cross-check that door counts match your distribution agreements. Validate that velocity assumptions reflect realistic expectations based on historical performance or comparable products. Finally, ensure summary totals and calculated metrics appear accurate and don't show formula errors.
Step 5: Running What-If Scenarios to Test Your Strategy
The most valuable use of this template comes from scenario analysis. Once you've built your baseline forecast, create copies to test alternative strategies and potential challenges.
Critical Scenarios to Model
Test aggressive promotional participation by increasing your markdown allowances and promotional lift factors. This scenario helps you understand if increased volume during Beauty Insider Sale actually delivers profitability, or if the margin compression destroys value.
Model supply chain disruptions that increase your COGS by 10-20%. With ongoing tariff uncertainty and freight volatility, this scenario reveals how much pricing power you need to maintain margins, or whether you need to renegotiate wholesale pricing with Sephora.
Create a conservative scenario with lower sell-through velocity to understand your downside risk. If products move 20-30% slower than planned, can you still meet profitability targets, or will excess inventory and markdown pressure create losses?
Test the impact of expanded distribution by modeling increases in door count. Understand the revenue upside of moving from 400 to 550 stores, and whether that expansion justifies the additional inventory investment and potential velocity dilution.
The Limits of Manual Forecasting
This template provides a solid foundation for Sephora account planning, but manual forecasting comes with inherent challenges. Updating your forecast monthly requires hours of data entry from multiple sources. Sephora vendor portal data, EDI invoices, and trade spend statements all need manual reconciliation.
Complex multi-channel operations create additional friction. If you're selling through Sephora, Ulta, Amazon, DTC, and other wholesale accounts simultaneously, maintaining separate Excel forecasts becomes unwieldy. Consolidating these channels into a comprehensive business view requires yet another layer of manual work.
Scenario planning in spreadsheets also hits practical limits. Creating and managing dozens of what-if scenarios manually is time-consuming and error-prone. By the time you've modeled various alternatives, market conditions have often changed, requiring you to start over.
When It's Time to Automate Your Sephora Forecasting
The template you've downloaded follows the Drivepoint SmartModel™ specification, making it AI-ready and designed for easy automation. This standardized structure means if you decide to graduate from manual forecasting, your template can be integrated into automated financial planning platforms with minimal rework.
Consider moving to automated forecasting when you face any of these challenges: spending more than 10 hours monthly updating forecasts across multiple channels, needing real-time visibility into performance versus plan, managing 3+ retail accounts beyond Sephora (like Ulta, Amazon, Target), or requiring instant scenario generation to support strategic decisions.
Modern AI-powered platforms can automatically ingest data from Sephora's EDI systems, vendor portal, and your accounting software, eliminating manual data entry entirely. These systems generate scenarios in seconds rather than hours, providing strategic insights when you need them most. For brands managing omnichannel operations, automated platforms consolidate all channels into a single source of truth.
Getting Started with Your Sephora Forecast
The Sephora P&L template gives you a comprehensive framework for understanding your retail account profitability. By accurately modeling sales velocity, trade spend, and COGS, you'll make informed decisions about promotional participation, pricing negotiations, and product mix.
Start by building your baseline forecast with conservative assumptions. As you gather actual performance data from Sephora, refine your velocity estimates and trade spend projections. Run multiple scenarios to understand your sensitivity to different outcomes, identifying which factors most impact profitability.
Remember that forecasting is iterative. Your first version won't be perfect, and that's expected. The goal is to establish a structured approach to planning that improves over time. As your Sephora account scales and your operations become more complex, you'll know when it's time to transition from manual forecasting to automated solutions that can keep pace with your growth.
Ready to take control of your Sephora account profitability? Download the free template now and start building your forecast today: Get the Sephora P&L Template