Managing a Walmart partnership requires sophisticated financial planning. Between promotional calendars, off-invoice deductions, co-op fees, and complex trade spend mechanics, even experienced finance teams can struggle to model the complete P&L impact of their Walmart business.
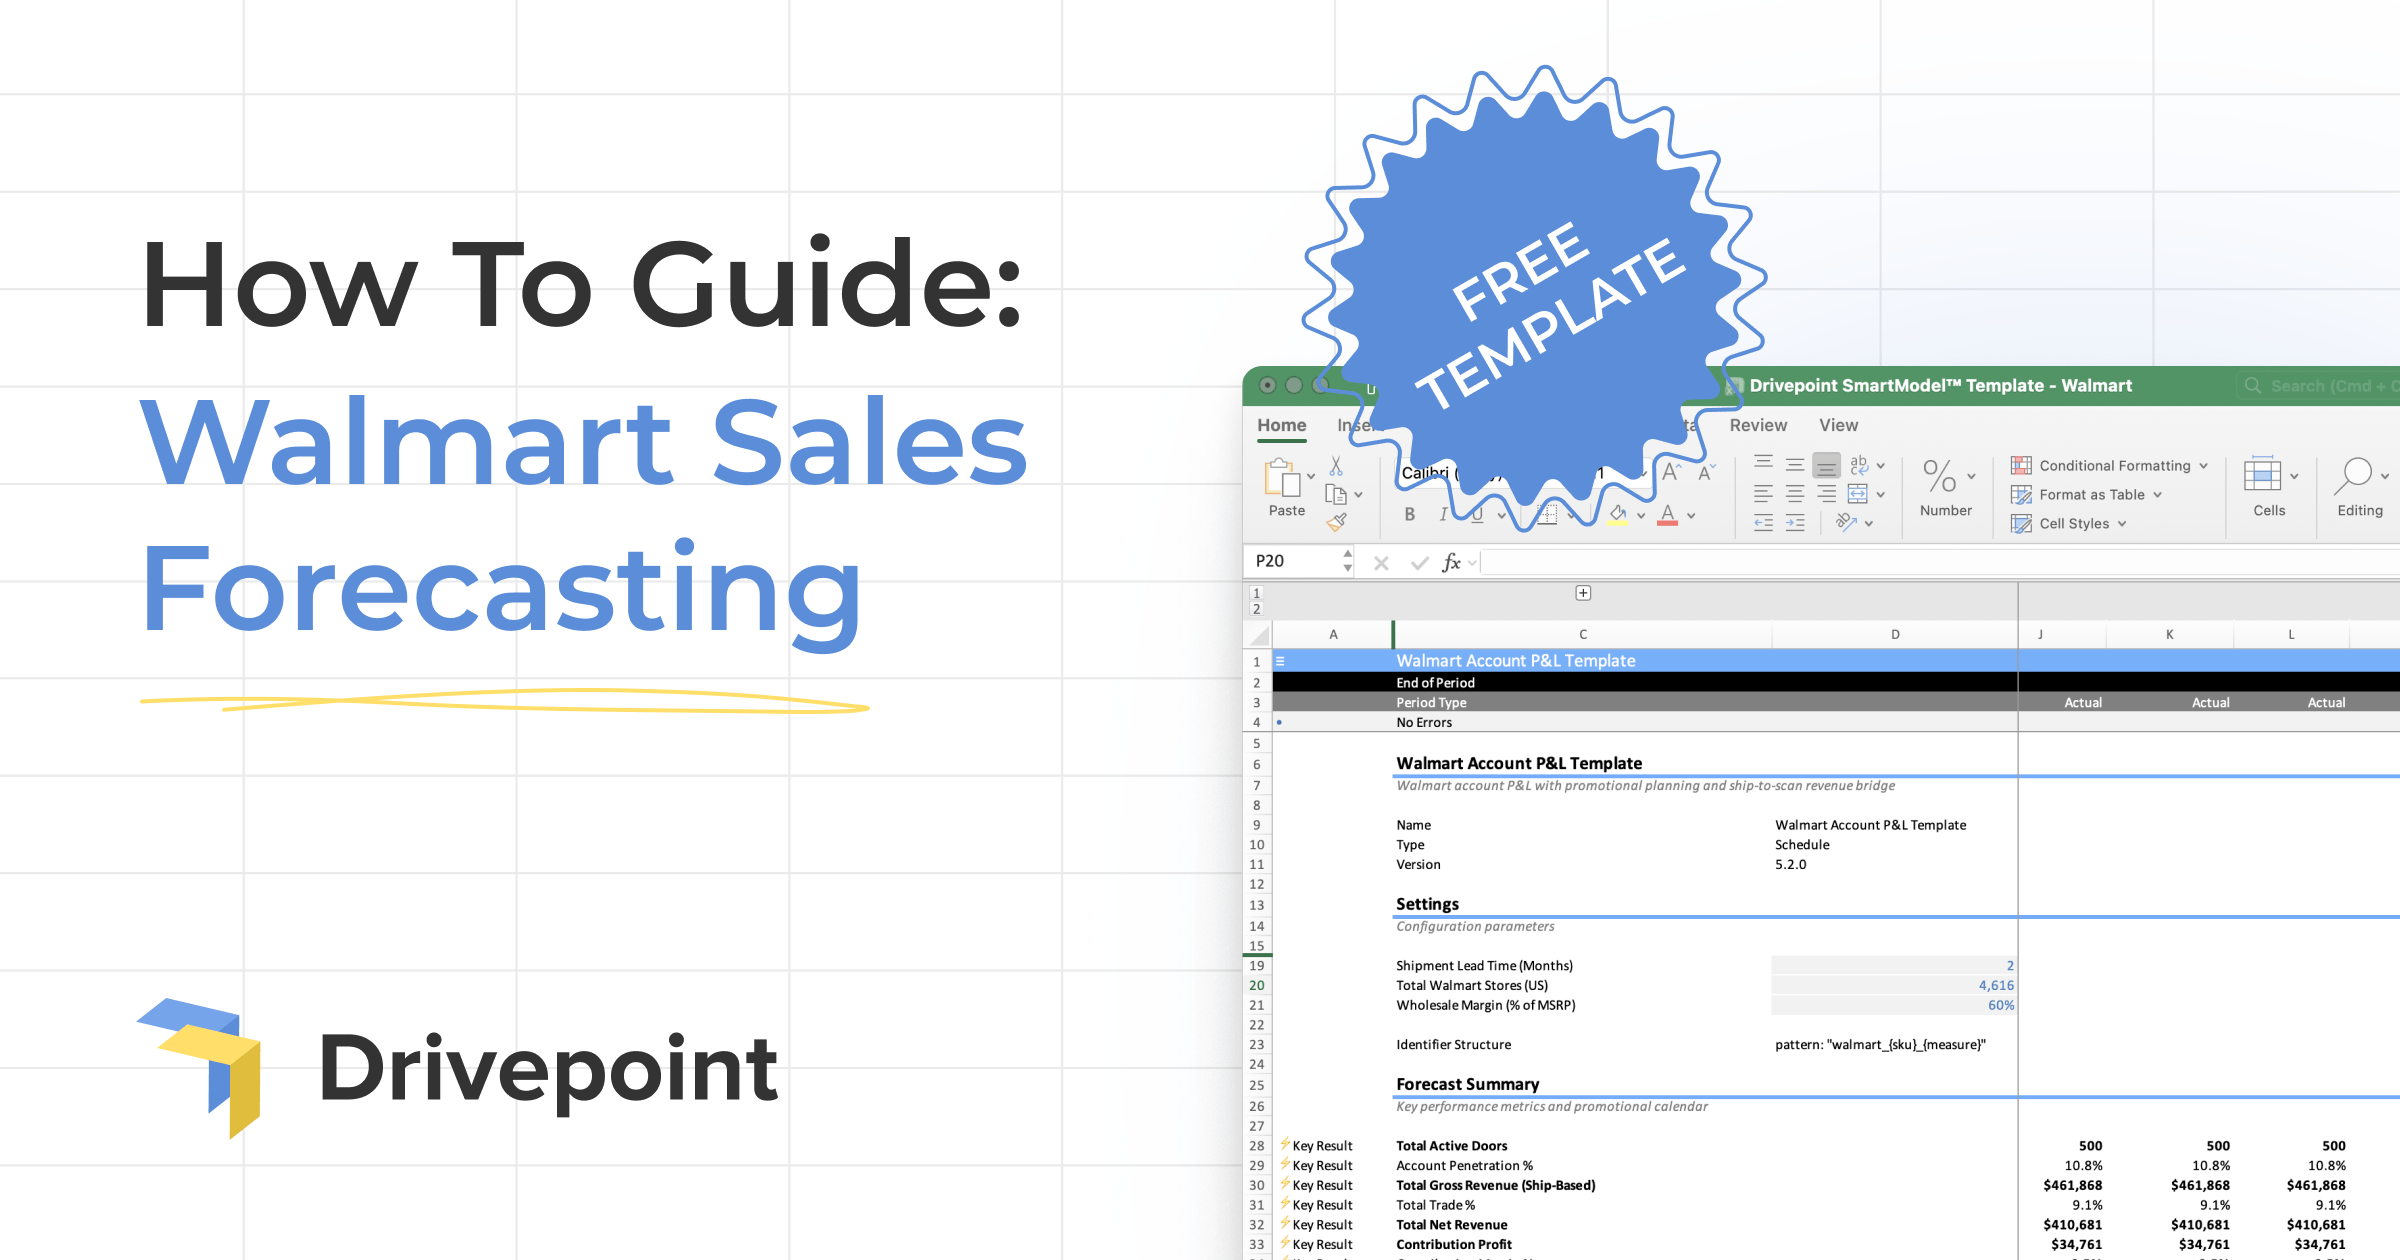
That's why we built this Walmart P&L Template. It's the same framework our customers use to model six and seven-figure Walmart launches, and we're making it available for free.
What This Template Does
This isn't a generic sales forecast. This is a complete account-level P&L model purpose-built for the specific economics of selling through Walmart. The template handles the complexity that makes Walmart forecasting uniquely challenging: promotional intensity, trade spend as a percentage of gross sales, retailer deductions, and contribution margin analysis that accounts for every dollar leaving your business.
Here's what you get:
Scan-Based Sales Forecasting: Model your Walmart business using scan-based revenue (what consumers actually buy at the register) with inputs for door count, baseline velocities, pricing strategy, and promotional lifts. This is how Walmart actually works: ship-based accounting for all P&L calculations.
Promotional Planning: Built-in promotional calendar pre-populated with Walmart's major events (Walmart Week, Back to School, Black Friday / Cyber Monday, Holiday Rollbacks). Assign promotional intensity (heavy at 1.0, moderate at 0.5, light at 0.0) and watch the model calculate the sales impact across your SKUs.
Complete Trade Spend Modeling: Navigate the maze of Walmart deductions with dedicated sections for off-invoice discounts, bill-backs, co-op fees, and other trade spend. Input your assumptions as percentages and see the dollar impact flow through to your bottom line.
SKU-Level Forecasting: Manage multiple SKUs across different door counts. Model baseline velocities, promotional lifts, and pricing by product. The template aggregates everything into account-level metrics while preserving SKU-level detail.
Contribution Margin Analysis: See your true profitability after accounting for gross revenue, all trade spend and deductions, product costs (COGS), and expected return rates. Know whether this Walmart partnership actually makes financial sense before you commit.
How to Use the Template
Step 1: Set Up Your SKU Structure
Start in the scan-based sales section by entering your product details. For each SKU, you'll input the product name, number of Walmart doors carrying the product, baseline scan velocity (units per door per week), and your retail price point.
The baseline velocity is your foundation. This represents normal week performance without promotional activity. If you're launching a new product, use comparable SKUs or industry benchmarks as your starting point. For existing products, pull actual scan data from your Walmart reports.
Step 2: Build Your Promotional Calendar
Walmart's promotional calendar is the heartbeat of your sales forecast. The template comes pre-populated with major 2026-2027 Walmart promotional periods, but you can modify these based on your specific promotional agreements.
For each promotional event, assign an intensity level. Heavy promotions (1.0) might be Walmart Week or Black Friday where you're running aggressive features. Moderate promotions (0.5) could be seasonal rollbacks or category-specific events. Light promotions (0.0) represent weeks with minimal activity like Easter or summer basics periods.
The model automatically calculates the promotional lift impact on your scan velocity. When you combine these promotional multipliers with your baseline velocities, you get a complete picture of expected consumer demand across the year.
Step 3: Model Your Trade Spend
This is where most Walmart forecasts fall apart. The template gives you dedicated sections to model every dollar leaving your business.
Discounts Section: Input your trade spend assumptions as percentages (off-invoice discounts, bill-backs, co-op fees, and other retailer deductions). The model calculates dollar impacts automatically based on your gross revenue.
Returns Section: Set your expected return rate as a percentage. Walmart returns vary by category, but don't skip this input. Returns directly impact your net revenue and cash flow.
COGS Section: Enter your product cost per unit for each SKU. The model uses this to calculate your true contribution margin after all deductions.
Step 4: Review Your Forecast Metrics
Once you've input your assumptions, the Forecast Summary Metrics section (rows 31-37) shows you the complete financial picture.
You'll see promo event intensity guidance based on your promotional calendar inputs, total doors summed across all active SKUs, account penetration as a percentage of Walmart's 1,963 total stores, and gross revenue calculated from ship-based sales before any deductions.
The model shows total trade spend as a percentage of gross sales which is a critical metric for understanding whether your Walmart economics are sustainable. You'll see net revenue after all deductions, and most importantly, contribution profit and margin that reveal your bottom-line profitability.
Step 5: Understand What You're Actually Modeling
Here's a critical distinction that trips up even experienced operators: The P&L uses ship-based revenue for all accounting calculations.
Your scan-based sales forecast drives the model's demand assumptions. The promotional calendar, door counts, and velocities all feed into understanding what consumers will buy. But the actual accounting—the revenue recognition, the trade spend calculations, the contribution margin analysis—all runs on shipped units, not scanned units.
Why does this matter? Because this is how the accounting actually works. You recognize revenue when you ship to Walmart, not when consumers buy at the register. This template models both realities: consumer demand through scan-based forecasting and financial impact through ship-based accounting.
What Makes This Template Different
Consumer brands shouldn't be building Walmart forecasts from scratch in blank spreadsheets. The promotional complexity, trade spend mechanics, and accounting nuances are too easy to get wrong. One missed deduction or incorrect promotional assumption can make a profitable-looking partnership actually unprofitable.
This template codifies the specific mechanics of Walmart partnerships. The promotional calendar reflects Walmart's actual retail calendar. The trade spend structure accounts for the unique deductions Walmart takes. The ship-based revenue approach matches how your accounting team will actually recognize the business.
Additionally, the template comes with a dedicated Walmart Promo Calendar tab pre-populated with 2026-2027 promotional events. Heavy promo events (1.0) include Walmart Week, Back to School, Black Friday / Cyber Monday, and Holiday Rollbacks. Moderate events (0.5) cover New Year Savings, Tax Refund Season, Spring Rollbacks, Memorial Day Savings, and Labor Day Rollbacks. Light or no-promo periods (0.0) include Easter and Summer Basics. You can modify these dates or add 2028+ data as needed; the formulas automatically update your forecast.
Common Forecasting Mistakes to Avoid
Ignoring promotional intensity: Walmart promotions aren't binary. The difference between Walmart Week (heavy) and a Spring Rollback (moderate) is significant. Model the actual intensity, not just "promo vs non-promo."
Underestimating trade spend: Off-invoice discounts, bill-backs, co-op fees, slotting—these aren't rounding errors. Trade spend often exceeds 20% of gross revenue. Model every deduction explicitly.
Forgetting about returns: Return rates vary by category but they're never zero. A 3-5% return rate might not sound material until you're managing a $2M account.
Using only scan-based accounting: Your finance team needs ship-based revenue for actual accounting. Model both realities.
Building one scenario: Your first forecast is a hypothesis. Run multiple scenarios with different door counts, promotional intensities, and trade spend assumptions. Understand the range of outcomes before committing.
Troubleshooting
If your ship-based revenue equals zero, check that lead time in cell D19 is populated and scan units are flowing through the model.
If promo allowances aren't calculating, verify that both promo_discount_pct and promo_flag are set in your promotional calendar inputs.
From Template to Strategic Advantage
This template solves the immediate problem: modeling a Walmart partnership accurately before you commit. But the deeper insight is understanding how world-class finance teams actually work.
The best consumer brands don't build one-off models for every retailer conversation. They maintain living financial models that represent their complete business (DTC, Amazon, wholesale, retail) updated automatically with actuals and ready to run scenarios instantly.
That's what Drivepoint does. We create your complete financial model in Excel, automatically updated with actuals from Shopify, Amazon, retail partners, and wholesale channels. Run unlimited retailer scenarios in minutes instead of days. Model Walmart, Target, and Kroger simultaneously to compare opportunities. See the complete P&L, cash flow, and inventory impact before making six-figure inventory commitments.
Our customers improve EBITDA margins by 6.7 percentage points on average within their first year. Not because we have a better spreadsheet, but because we flip the 80/20 from manual data work to strategic analysis. Finance teams spend their time modeling scenarios and making recommendations instead of building templates from scratch.
If you're evaluating one Walmart partnership, this template gives you what you need. If you're managing a $50M+ omnichannel business with multiple retail partners and hundreds of SKUs, the manual approach breaks down fast.
Ready to move beyond one-off templates? Book a demo to see how Drivepoint transforms retail planning from a weeks-long project into a minutes-long analysis.
>> Download the Walmart Forecasting Template